| |||
|
|
||
Experiment in Geosciences, 2000, V.9, N.1, pp.39-41
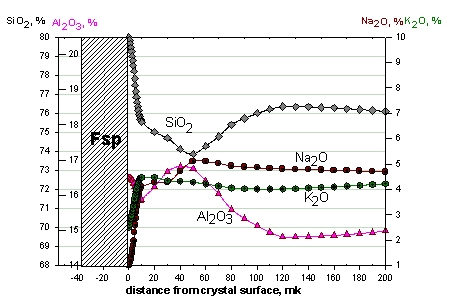
The influence of boundary layer effects on the melt inclusions compositions.Pletchov P.Y., Trusov S.V. Moscow State University 119899 Moscow Vorobyovy Gory key words: [melt inclusions, experiment, diffusion, boundary layer effect] Introduction. It is well known that the melt composition at the surface of growing crystal is very different from the bulk melt composition owing to the boundary effects of redistribution of a substance between the melt and the crystal. The observed width of this layer varies from 10-15 ╣m (for basalt melts of low viscosity) to 100-150 ╣m (for rhyolite melt) in dependence on melt viscosity and growth conditions. Taking into account that melt inclusions form from the melt portion adjacent to the growing crystal, it can be assumed that their composition is distorted in comparison to the bulk composition. Smith et al. [1] first showed that the melt in the boundary layer would be depleted in compatible components and enriched in incompatible components. The experimental reproduction of the boundary effects In order to distinguish an influence of the boundary effects on the composition of melt inclusions, the experiment on growth of alkali feldspar (Fsp) crystal in the haplogranitic system (Q-Ab-Or) was performed. The system was cooled during 6 days from 760 to 700oC with a rate of 10o/day, and subsequently quenched. As a result, diffusion profiles around Fsp crystals were produced (Fig.1). The profiles show an enrichment of the boundary layer at the crystal surface in the components, whose concentration in Fsp is lower, then in the melt (for example, SiO2). However, a depletion in SiO2 and an enrichment in Al2O3 are observed in the portion of the profile remote from the surface. This effect is difficult to explain by simple diffusion transport of the components from the growing face.
The authors carried out a computer modeling of the growth of Fsp crystal in the granite melt. We used an equation of a multicomponent diffusion and an algorithm of Oishi [2]. The crystal growth was modeled by the mechanism of the layer-by-layer growth. Diffusion coefficients were taken from [3, 4]. The major difficulty was to model the portion of the profile, which is remote from the growing face. The profile configuration (Fig. 1) implies head diffusion fluxes, which transport component to the opposite sides. It means that these components would be present in the melt as different species. The flux directed to the crystal would be exhausted by the growing face, in order to form a concentration gradient. An assumption that component transportation toward the growing face occurs by species, whose composition is similar to the growing mineral, allowed to obtain satisfactory results of modeling.
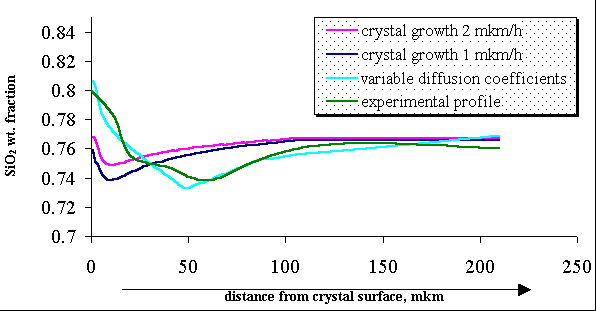
Fig.1a shows two calculated diffusion curves for silica during Fsp growth with rates 1 and 2 ╣m/hour and a curve calculated with changing diffusivities (a dependence of diffusivity on concentration was added). It should be noted, that the calculated diffusion profiles are not stationary in time and can be considered as an oscillatory system (a period of oscillations depends on frequency of new layer production). Uncertainty of some parameters, such as diffusivities of complexes in the melt, their sizes, chemical interaction between them etc., does not allow to create a complete numerical model of the process. Estimation of an influence of the boundary effect on melt inclusion composition If we suggest, that melt inclusions partially capture the boundary layer, then composition of small inclusions would correspond to an average composition of the trapped portion of the boundary layer. The larger inclusion the weaker its influence on the boundary layer.
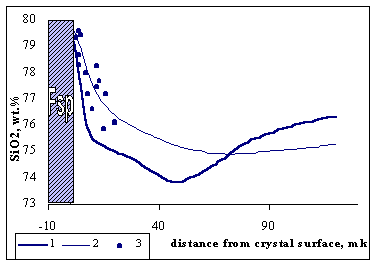
Fig.2 shows the calculated curves of an average composition of the boundary layer in dependence on inclusion size. Points on the diagram show a composition of melt inclusion, whose diameter corresponds to the dimension of the X-axis. Generally, good correlation between the predicted and the measured compositions of melt inclusions is observed. Thus, study of diffusion profiles gives a possibility to calculate a correction for composition of melt inclusions. Theoretical modeling of crystal growth in synthetic systems reproduces the experimental profiles through the boundary layer and probably can be used for the prediction of composition of melt inclusions. References:
|
 |  | |
| ||